Mastering Filtering in Flexmonster Pivot
Flexmonster's Pivot Table is designed to empower users to analyze vast datasets with ease. One key feature is its robust filtering functionality. By understanding its configurations, you can ensure your reports focus on the most relevant information.
Let's embark on a data exploration journey using everyone's favorite fictional creatures – Pokemon!
Imagine a dataset containing information on every Pokemon species. While this data offers a comprehensive overview, what if you're interested in a specific subset? Perhaps you only want to analyze Electric-type Pokemon, or maybe you want to find the best party for the battle? Let’s see how the filtering works in Flexmonster using this dataset.
Types of filtering in Flexmonster Pivot Table
Out-of-the-box Flexmonster allows one to apply filters in two ways – to a specific field or the whole report.
Using field filters, you can display different data based on members of specific fields from the slice. Three types of field filters, filtering by condition, selection, and value, provide different functionality for various purposes.
Report filters are special fields used for filtering data in the whole report without being shown on the grid and charts. This filter is based on a field that is not in a slice and is not displayed on a grid though it influences which data will be aggregated. The filtering is performed by applying the conditional or selection filters, similar to fields in rows and columns.
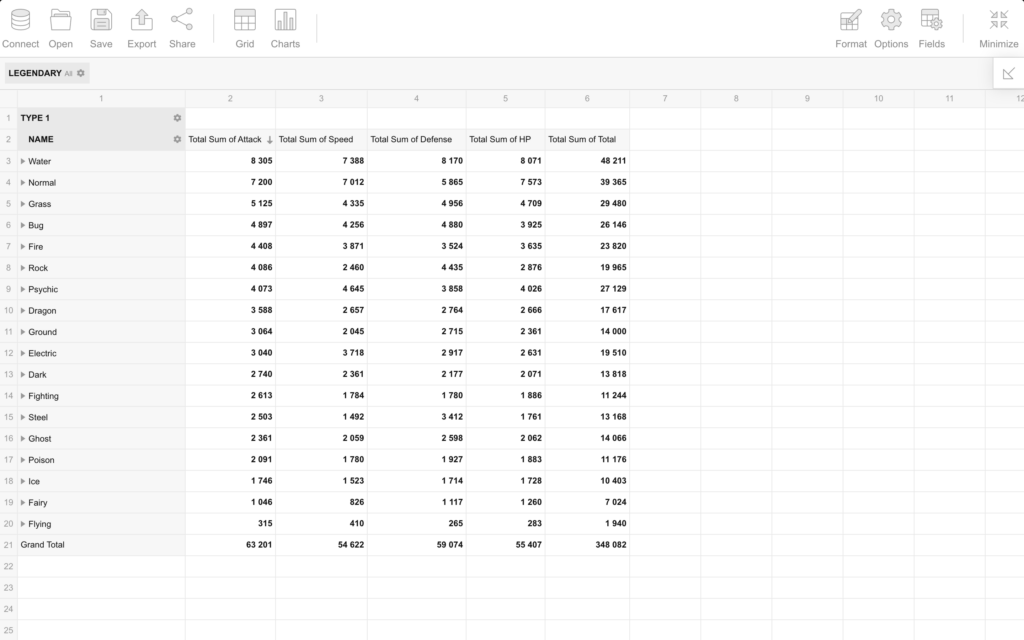
We will work with a simple Pokemon data slice, shown in the screenshot below. Each Pokemon's characteristics are presented by its name and grouped by type, with a Legendary report filter on top of the grid.

Now, let’s look at some examples of how to apply some of these filters in code and via UI.
How to filter by condition in a pivot table
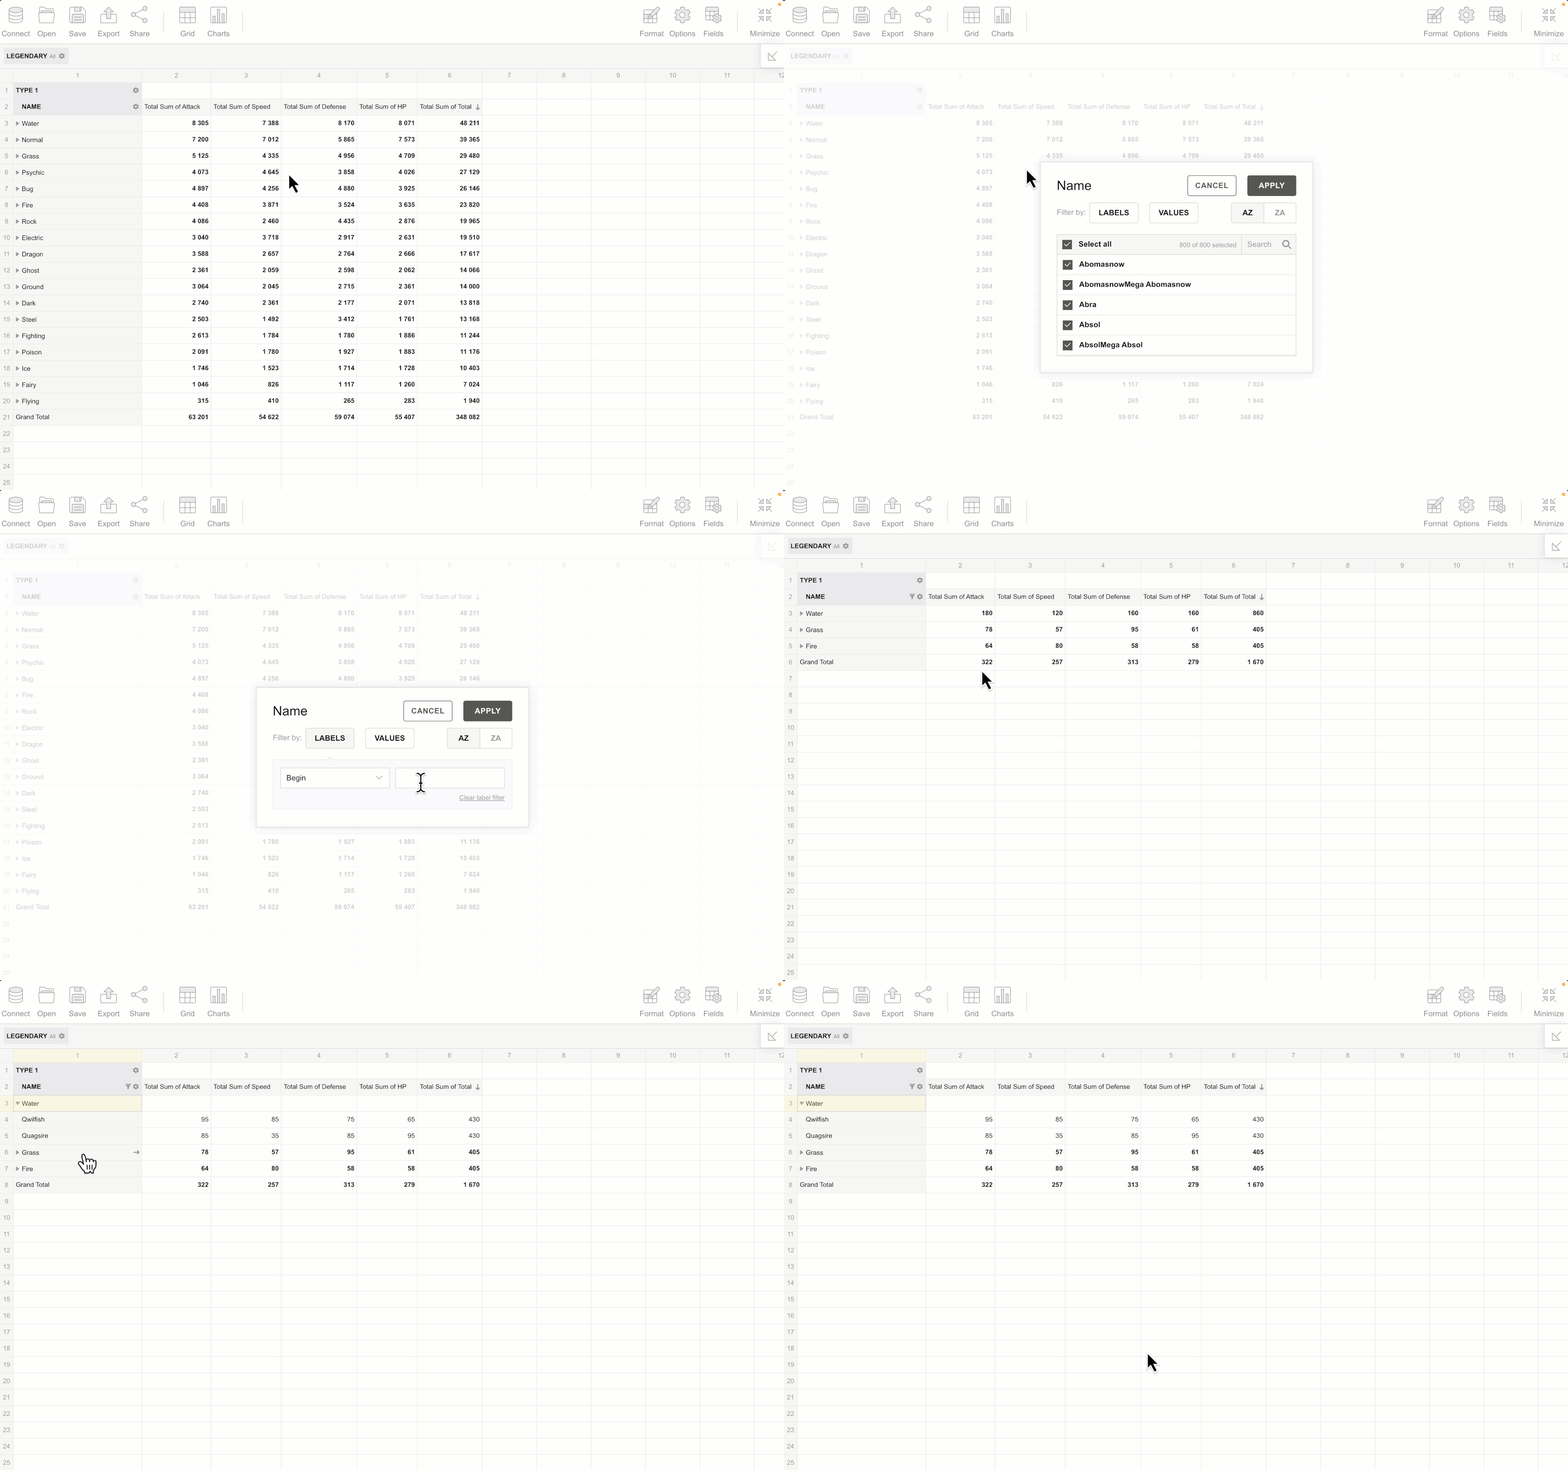
In Flexmonster, you can filter field members based on certain conditions. For example, you want to see only Pokemon whose names begin with "Q".
In code, the configured filter for this field in rows will look the next way:
"rows": [
  {
    "uniqueName": "Name",
    "filter": {
      "query": {
        "begin": "Q"
      }
    }
  }
]
You can configure this filter via code using the setFilter API call:
flexmonster.setFilter("Name", {
  query: {
    begin: "Q",
  },
});
To do this via UI, follow these simple steps:
Step 1. Click on the field name you want to filter (for example, the "Name" field, which represents our Pokemon names) or use the field’s context menu. This will open the filter view.
Step 2. The filter options change depending on the data type. For Pokemon names, you'll need the "Label" filter type. This opens a pop-up window where you can tell Flexmonster exactly what you're looking for.
Step 3. Choose a condition from the dropdown menu (e.g., Begin). Type your chosen letters into the input field next to it. In our example, it is “Q”.
Step 4. Once you've set up your filter, click the APPLY button. Flexmonster will then spring into action, showing you only the Pokemon that match your criteria.
As a result, only the Pokemon names that start with “Q” will be shown on the screen. Check out how it works:

If you want to remove the filter:
Step 1. Open the filter view by clicking the field’s name or using the field’s context menu.
Step 2. Select the Clear filter option located in the lower-right corner of the subview:
Step 3. Click the APPLY button to save your changes.
Or use the clearFilter() API call:
flexmonster.clearFilter("Name");How to filter by selection in a pivot table
Filter by selection allows for selecting specific field members to be displayed. For example, we want to see only the fire- and grass-type Pokemon on the grid. Let’s use the report filter for this.
To configure it, add the next code to your rows slice part:
"rows": [
  {
    "uniqueName": "Type 1",
    "filter": {
      "members": [
        "type 1.[fire]",
        "type 1.[grass]"
      ]
    }
  }
]
To configure this filter via code, use the setFilter API call:
flexmonster.setFilter("Type 1", {
  members: [
    "type 1.[fire]",
    "type 1.[grass]",
  ],
});
If you prefer using UI, follow the steps below:
Step 1. Open the filter view by clicking the field’s name or using the field’s context menu.
Step 2. Use the checkboxes to select field members that should be displayed or hidden.
Step 3. Once the filter is configured, click the APPLY button to save your configuration.

If you want to remove the filter:
Step 1. Open the filter view by clicking the field’s name or using the field’s context menu.
Step 2. Select the Select all checkbox to choose all members:
Step 3. Click the APPLY button to save your changes.
Or use the clearFilter() API call:
flexmonster.clearFilter("Type 1");How to filter to show the top 10 in a pivot table
Using filter by value, you can filter field members based on values of a certain measure. For instance, you can display the top 10 Pokemon with the most powerful attack.
Use the setFilter API call to configure this filter via code:
flexmonster.setFilter("Name", {
  measure: {
    uniqueName: "Attack",
    aggregation: "sum",
  },
  query: {
    top: 10,
  },
});
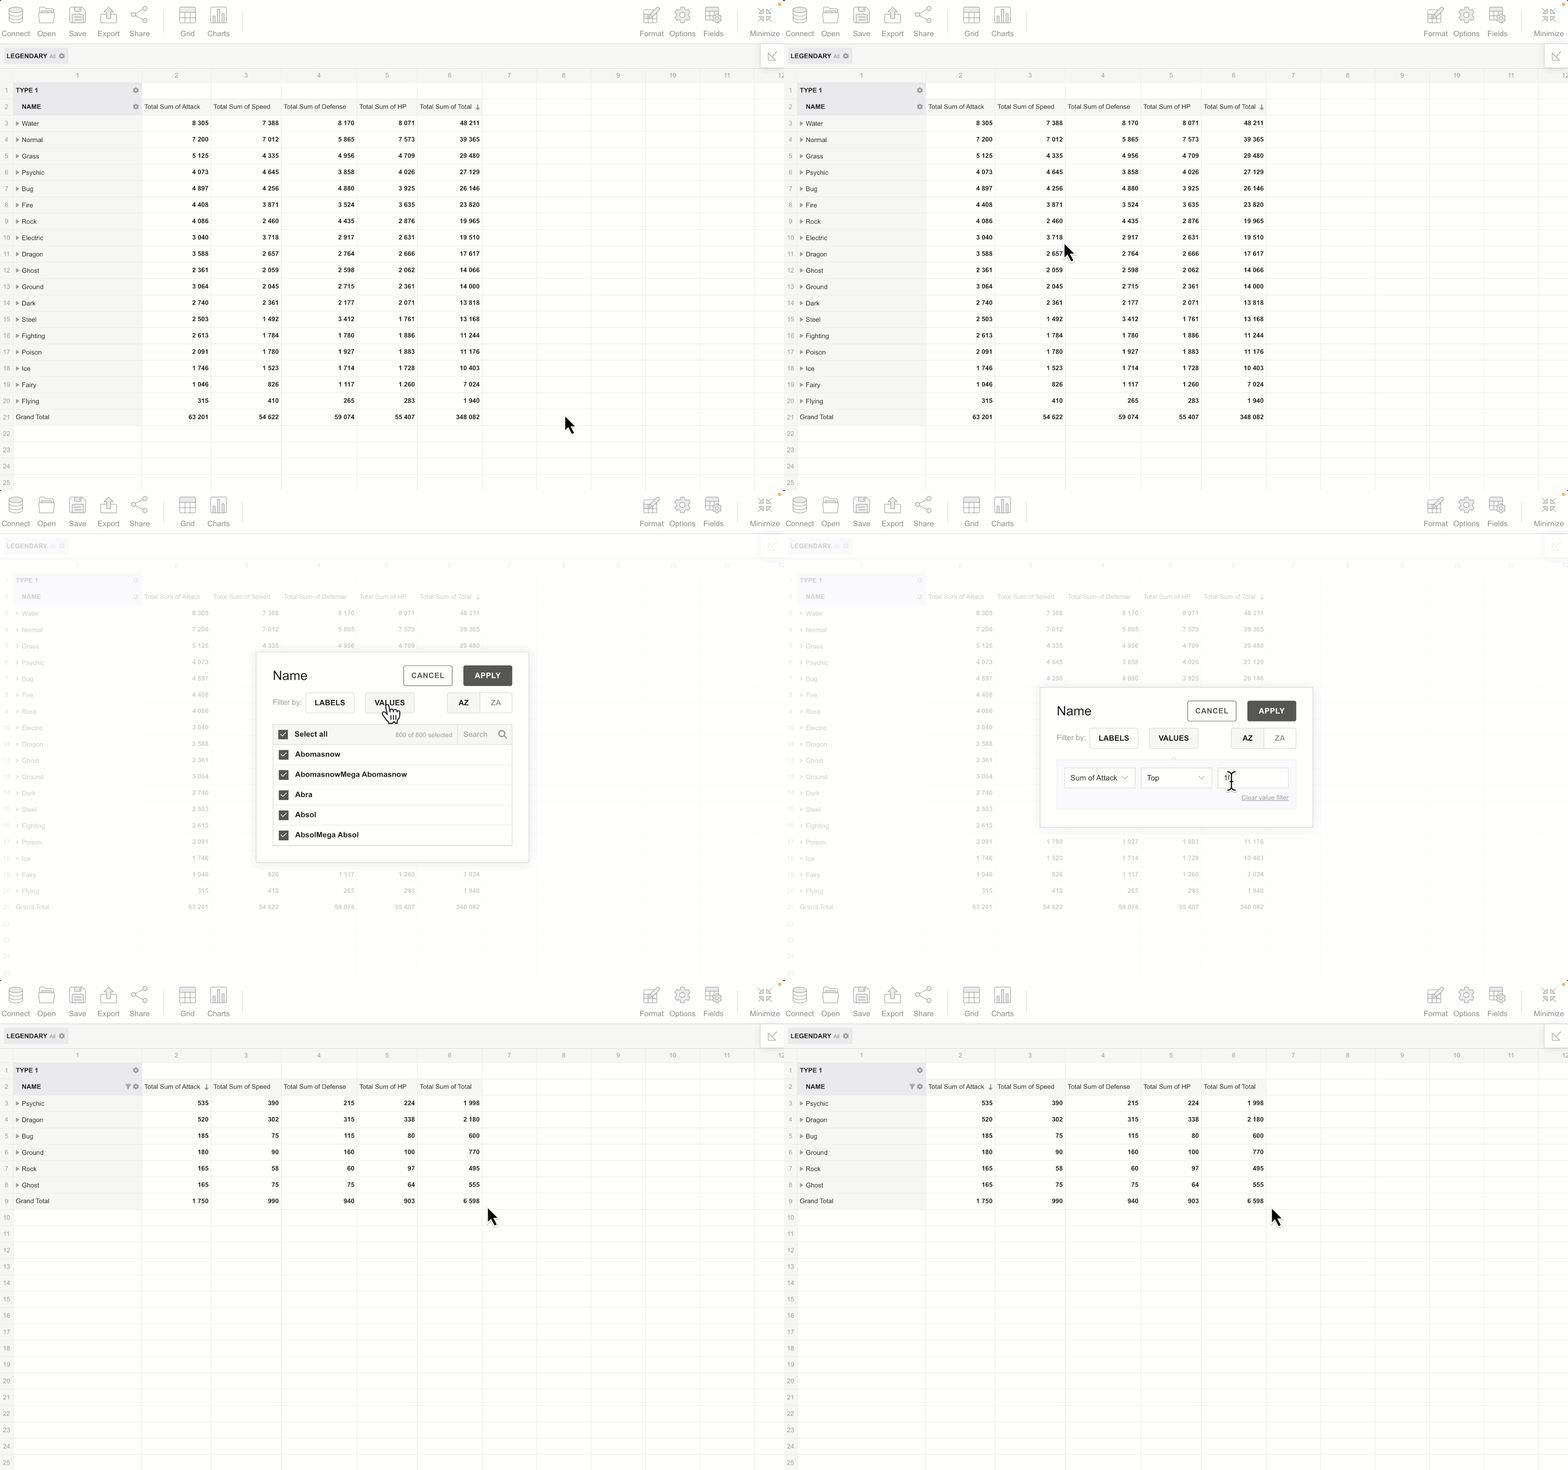
To use the UI, follow these simple steps:
Step 1. Click on the field you want to filter, like "Name". You can also right-click the field to open the filter’s context menu.
Step 2. See all those filter options? This time, we want "VALUES" filtering. This unlocks a special section where you tell Flexmonster what kind of filtering you want.
Step 3. Choose the "Sum of Attack" measure from the dropdown menu. Then, pick a condition like "Top" and enter a number, like "10" to see the top 10 attackers.
Step 4. Click the APPLY button, and Flexmonster will transform your data! You'll see only the 10 Pokemon with the most powerful attacks, ready for battle.
See how it works:

If you want to remove the filter:
Step 1. Open the filter view by clicking the field’s name or using the field’s context menu.
Step 2. Select the Clear value filter option located in the lower-right corner of the subview:
Step 3. Click the APPLY button to save your changes.
Or use the clearFilter() API call:
flexmonster.clearFilter("Name");Report filters in a pivot table
Report filters allow you to focus on specific subsets of data, making your reports more concise and easier to understand. Imagine you want to observe only the legendary Pokemon. Report filters were created to do it for you!
There are two ways to add report filters: via code and via UI.
Add report filters via code
In the slice, add a report filter. Then, add the conditional or the selection filter to the specified fields. In our case, we add a selection filter:
slice: {
  reportFilters: [{
    uniqueName: "Is Legendary",
    filter: {
      members: [
        "is legendary.[true]",
      ]
    }
  }],
  // Slice configuration
}
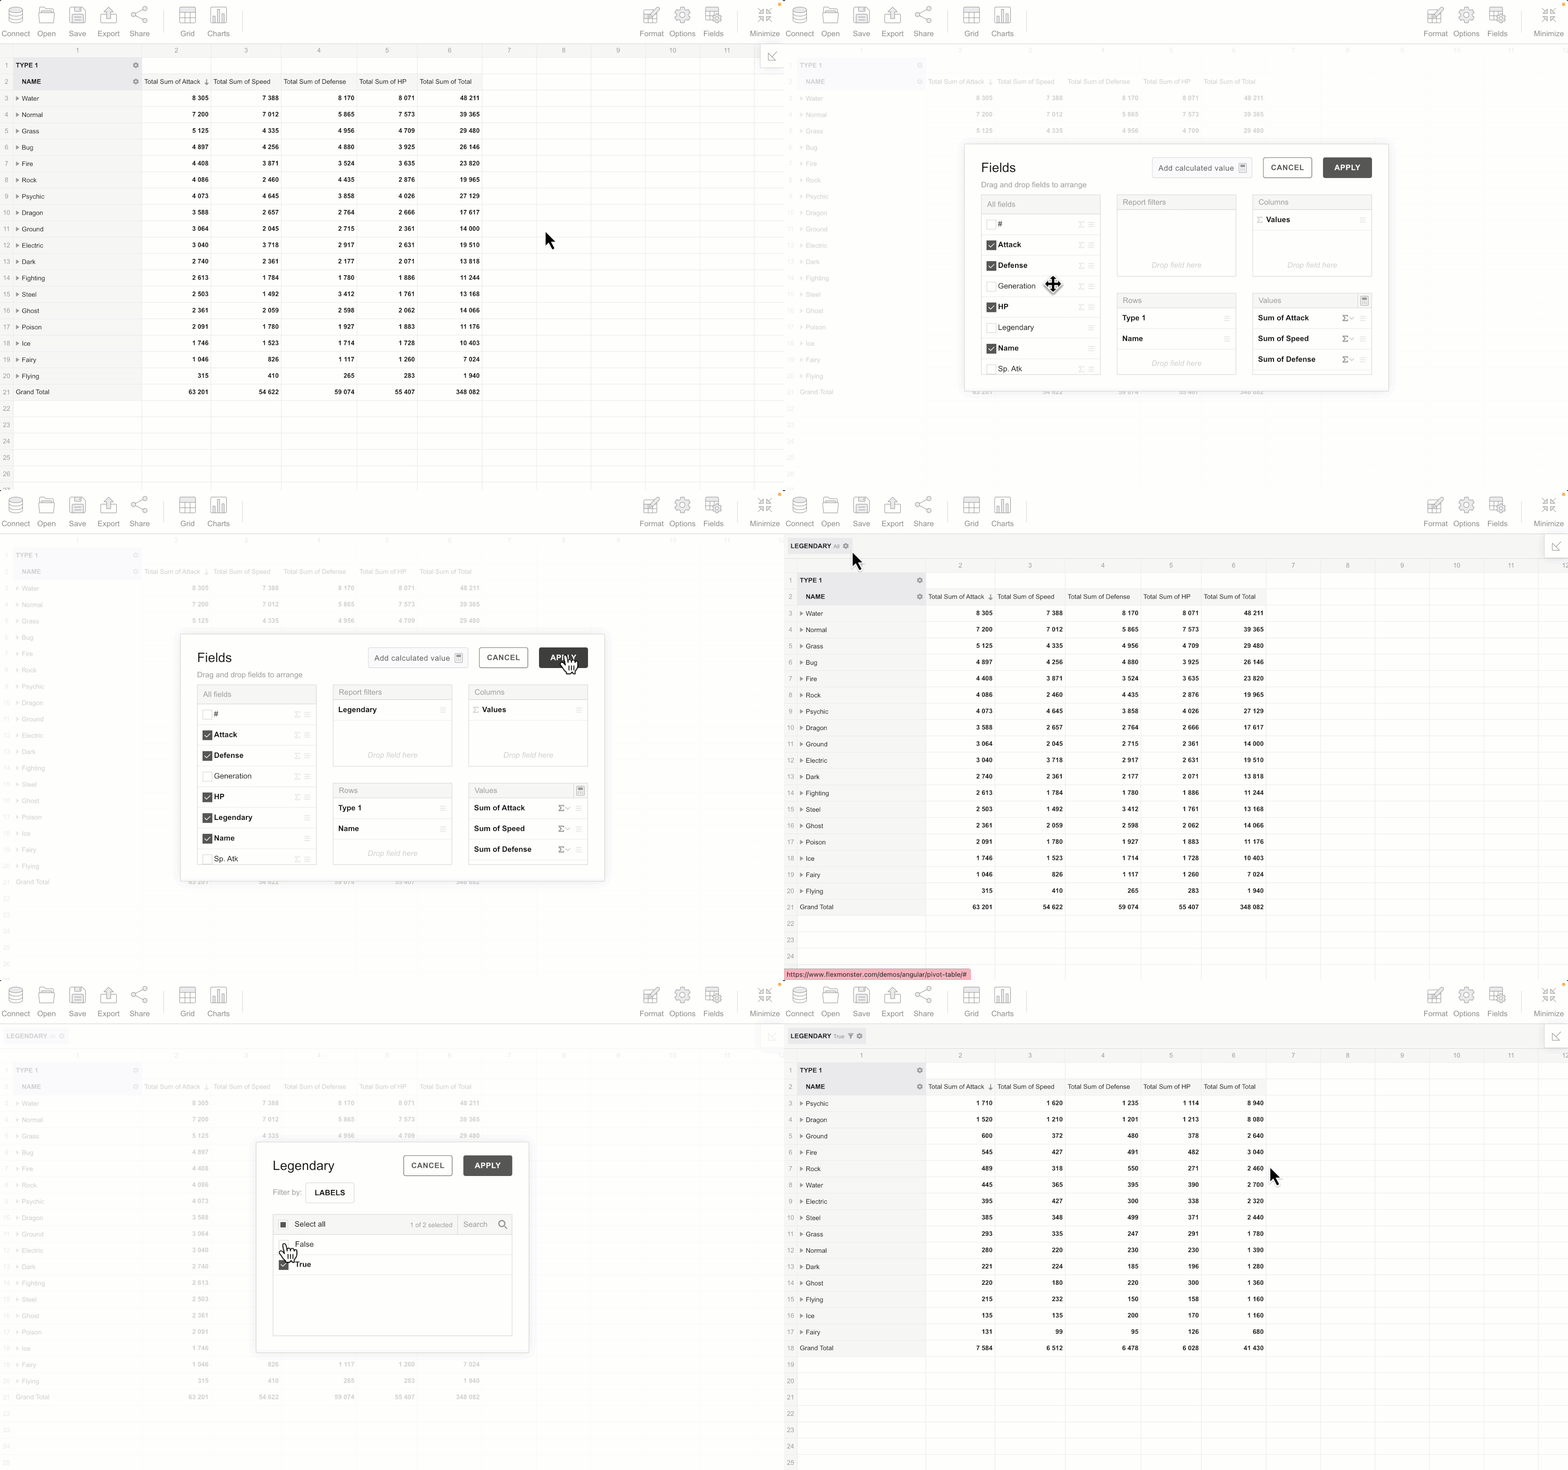
Add report filters via UI
Step 1. Open the Field List using the diagonal arrow in the upper-right corner of the component.
Step 2. Drag the required fields to the Report filters box. Then, click the APPLY button.
Step 3. Apply the conditional or the selection filter to the selected fields. In our case, we add a selection filter.
Here is an example:

To add or change report filters at runtime, use the runQuery() API call:
let slice = {
  reportFilters: [{
    uniqueName: "Color",
    filter: { members: ["color.[green]"] }
  }],
  // Slice configuration
};

pivot.runQuery(slice);
More about filtering in Flexmonster
You can explore all the details about filtering options in Flexmonster in our documentation.
For a deeper dive into Flexmonster filtering, watch our video guide:
Also, for special cases, we have some advanced tips and examples for you:


