Embed into your application. Customize to your needs. Analyze business data.
Play with the demo on a larger screen: save this link for later or watch the video review now.
Join hundreds of happy customers



Flexmonster Pivot Table provides official wrappers for React, Angular, Vue, Blazor, Svelte, and other modern frameworks, alongside native JavaScript and TypeScript APIs.
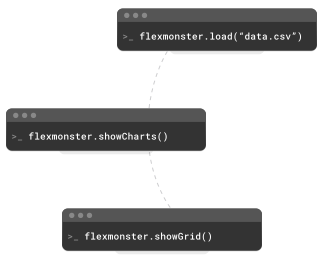
Get up and running in a few lines of code:
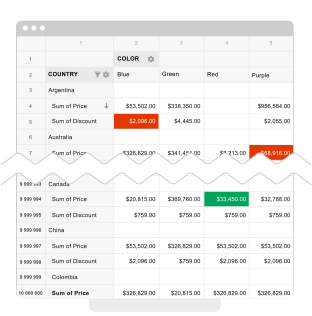
Built for enterprise reporting, the component keeps the app responsive under heavy loads.
The component is designed to easily become a part of your BI solution, CRM, ERP, SaaS, or business project, with full control over the user experience:
Flexmonster is built for developers. You embed and configure it in your app; your users get a full Excel-like reporting experience out of the box.

Interactive reporting built into the UI.
Build and reshape reports by dragging fields, with no code required.
Filter by selected members, conditions, or values, then sort the results to focus on relevant data.
Navigate hierarchical data with drill-down and explore the records behind aggregated values with drill-through.
Analyze data in charts with the same core pivoting capabilities as the grid: aggregation, filtering, drill-down, and drill-through.
Create formula-based metrics that aren't present in the original dataset.
Automatically highlight values that meet specific conditions and need attention.
Export reports to Excel, PDF, or CSV for further analysis.

A reporting layer that fits your stack and product.
Keep data exploration fast and responsive, even with huge datasets.
Embed Flexmonster in React, Angular, Vue, or other applications that support JavaScript.
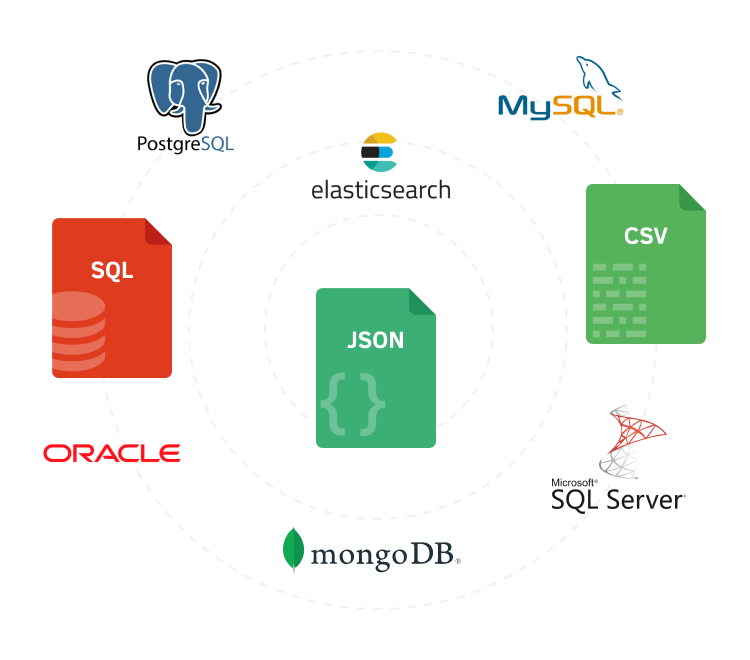
Load data from JSON or CSV files, SQL and NoSQL databases, OLAP cubes, or custom backends.
Choose which built-in features users can access and add custom controls for your product's workflows.
Visualize Flexmonster data with your preferred third-party charting library.
Style colors, fonts, and other UI details with CSS to match your product.
Translate UI labels into any language with ready-made or custom localization files.
Can't find your answer here?
Visit the FAQ page
Flexmonster Pivot Table & Charts is a JavaScript pivot table component for adding interactive reporting and data analysis to web applications. Users can summarize, filter, sort, and explore data in pivot tables and charts, drill into results, and export reports.

